comark-flint-chart
Search…
k
Search…
k
Flint charts
in Comark
A
Comark
plugin for
Flint
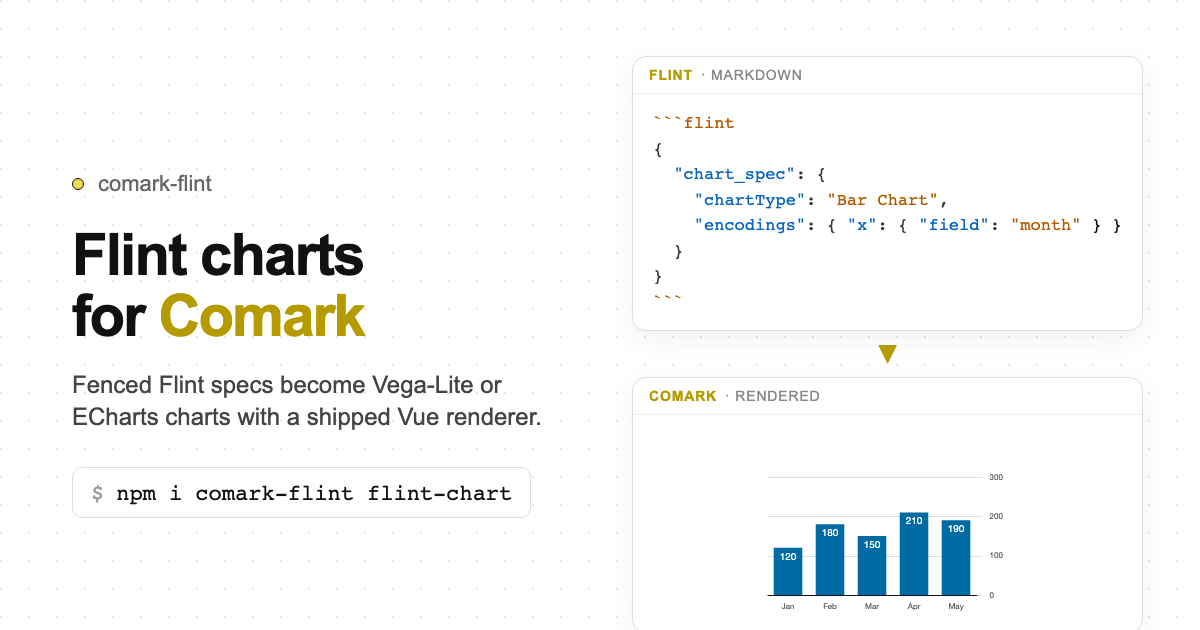
charts. Compiles Flint specs into backend-native charts and emits a
<Flint>
component node. Ships a Vue renderer; parse-time SVG/img is opt-in for static docs.
Get started
Open the playground
What you can do
Author charts two ways
Fenced ```flint blocks for static JSON specs, or ::flint directives with bound :spec paths.
Pick a backend
Vega-Lite (default), ECharts, Chart.js, Plotly, or Excel — each with its own assembler and SSR support.
Render with Vue
Default output is a Flint component node. Register the shipped Vue renderer for interactive charts.
Export static SVG
Opt in to output: svg or img for parse-time static docs and PDF pipelines.
Set frontmatter defaults
Global backend, theme, output, width, and height under flint: in document frontmatter.
Bind specs at parse or render time
Literal JSON compiles at parse time; :spec="live.data" stays in the AST for the renderer.